The Most Likely People to Survive the Titanic
The crashing of the Titanic has been one of the most tragic events in human history, with a total of 1,503 deaths. It’s difficult to imagine what you would have done if you were in that situation. Aboard the ship, some people were more likely to survive than others. In this project, I am going to use a predictive model to find out who was more likely to survive, and who was not so fortunate.
The Data
The data contained roughly 900 passengers and their specific features (gender, age, ticket class, fare, siblings, parents, cabin number, and port of embarkation). The age column had a lot of null values, so I had to impute them using linear regression.
The Models
I decided to use 4 different types of models: Decision Trees, Bagged Decision Trees, K-Nearest Neighbors, and Logistic Regression. After fitting all my models and applying a Grid Search to find optimum parameters. I found that my highest average cross val score to be Decision Trees with 0.83. I found the accuracy of this model to be 0.85, which means that I correctly classified 85% of the people on whether or not they survived. The precision was 0.89. This means that 89% of the people that I predicted would survive actually did survive. The recall was 0.7. This means that I correctly predicted 70% of the survivors out of all the survivors. Given that there are only 900 rows, this is a pretty good result.

After evaluating the model, I wanted to know which features affected survival rate the most. I found that gender was the most deterministic factor in whether or not a person aboard the Titanic would survive. The gender feature had a coefficient of 0.57. Females were more likely to survive than males. In fact, 81% of the men in the dataset died. Also, the second most predictive feature was whether or not they were in 3rd class. So if you were a man in 3rd class on the Titanic, you wouldn’t be so lucky.
ROC Curve
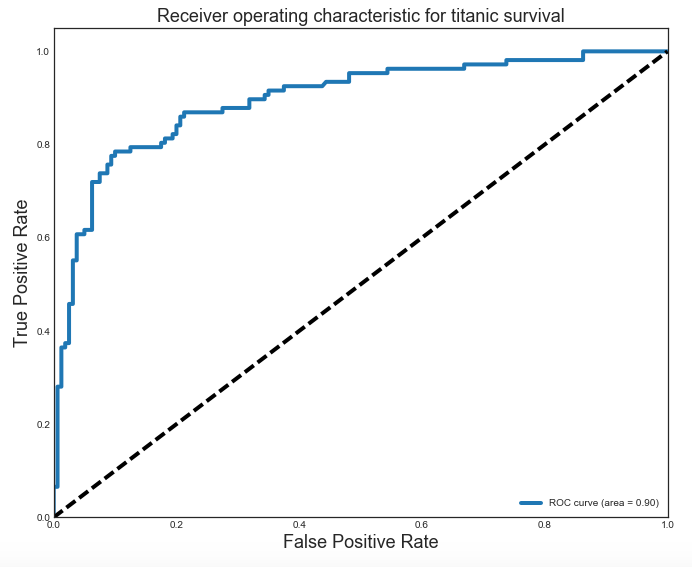
In order to fully understand our model, let’s plot a receiver operating characteristic curve (ROC) and find the area under the curve (AUC)

This curve plots the false positive rate (x-axis) with the true positive rate (y-axis). A very good model will stay close to the top left corner, while a horrible model will be at or below the diagonal line. The diagonal line represents the random chance if you were guessing which is 0.5. Our model is in the middle between 0.5 and a perfect model. If we want to maximize the true positive rate and minimize the false positives, we should choose a threshold somewhere in the middle where false positive rate is 0.2 and the true positive rate is 0.85. The AUC appears to be 0.9 where 90% of the area is under the curve. A perfect model would have 100% AUC, so 90% is fairly decent.
Conclusion
It’s easy to gauge which type of people would most likely survive and who would die by using statistics and machine learning algorithms. Men in 3rd class were most likely to die, which is sad but true. One thing I could have done better was dummify the ages to put them into buckets. This would allow me to see which age ranges were more likely to survive given that age was a factor in determining survival.
If this disaster were to happen today, it’s difficult to judge who should get the limited resources and be allowed on the very few lifeboats. We should prioritize young children and women, but also not forget men. Maximizing the number of people per lifeboat is also a must. Saving as many people as possible would be the ultimate goal.
Please check out the original code in my jupyter notebook here