Predicting Real Estate Prices
The real estate market in Ames, Iowa constantly fluctuates in sale price. Therefore, it’s important to figure out what causes these fluctuations and if it’s possible to predict which neighborhoods and types of houses will increase in sale price. This article attempts to find which features, if any, significantly contribute to the changes in sale price and if there are any other useful insights we can gleam from the data.
The Data
Kaggle has sourced us with information on the real-estate market in Ames, and we decided to look at 19 features in order to save costs and record less data. The data had 1,460 rows (each house) and 19 columns(each feature). These 19 features include: Lot Area, Utilities, Neighborhood, Building Type, House Style, Overall Quality, Overall Condition, Year Built, Year Remodeled, Roof Style, Roof Material, Greater Living Area, Full Bath, Half Bath, Bedroom Above Ground, Kitchen Above Ground, Month Sold, Year Sold, and Sale Price.
The Hypothesis
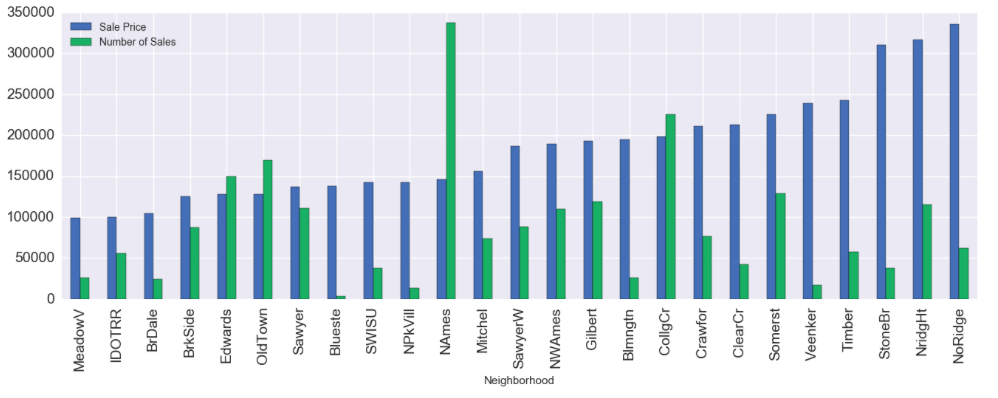
Analyzing the data, I proposed the hypothesis that the sale price itself determines how many houses are sold in a neighborhood. The reason behind this judgement is that most people cannot afford overly expensive real estate. Thus, the average sale price of a neighborhood would cause less sales due to high prices, and vice versa with cheaper neighborhoods. Graphing the data, here is what I found:

This graph shows each neighborhood’s average sale price (blue) and number of houses sold (green). As average sale price increases across neighborhoods, the number of houses sold varies from neighborhood to neighborhood. It is clear that there is no direct relationship between sale price and number of sales. I must reject my hypothesis.
The Model
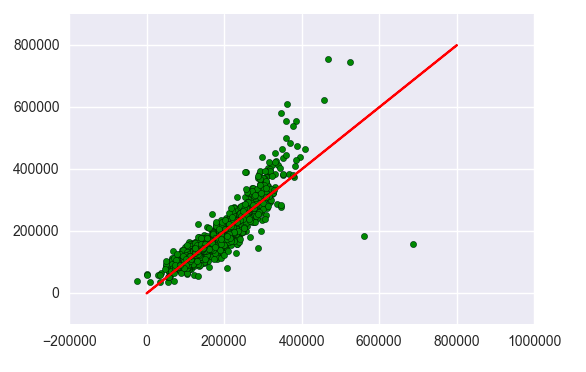
Rather than guessing which features affect sales, I’ll have a computer find which features are most significant. My most efficient model was a ridge model using cross validation, which got an r-squared score of 0.78 . This graph plots the predicted values (x-axis) by the actual values (y-axis). The model demonstrates accuracy if it follows the red line.

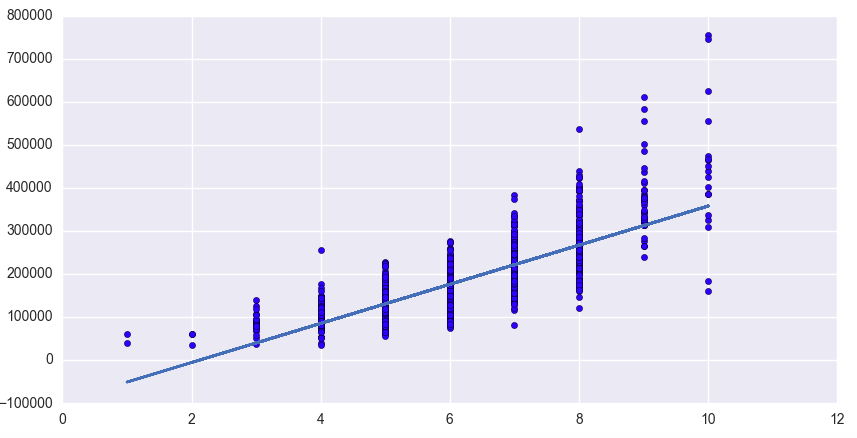
Through the model, I found which feature had the most weight (coefficient) that wasn’t a dummy variable. My findings show that the most significant factor that affects sale price was the overall quality.

The graph shows a direct relationship between overall quality (scaled 1-10) and sale price. Thus, the higher the overall quality means the higher the sale price. Then we should also ask, which neighborhoods have the highest overall quality? I found that Northridge Heights, Stone Brooke, North Ridge, Somerst, and Bloomington topped the list for quality in Ames, Iowa.
Conclusion
As an advisor, I would suggest investing in Northridge Heights, Stone Brooke, North Ridge, Somerst, and Bloomington real estate. I would specifically target houses with high overall quality. One large problem with the data is that it does not show who rates the overall quality and what factors into judging the overall quality. It would be insightful to look into this aspect.
Please check out the original code in my jupyter notebook here